MarketPath
The market engine. MarketPath generates the futures your plan is tested against: monthly paths for stocks, bonds, inflation, and interest rates, simulated as one linked economy that starts from the market you actually face today.
Why not just use historical averages?
Because no one retires into the average market. Two retirements with the same average return can end in very different places depending on the order the good and bad years arrive; a hard first decade with steady withdrawals can sink a plan the average called safe.
And history is a single sample. The American twentieth century was a remarkably good draw, and replaying it assumes you get the same luck. MarketPath treats history as evidence about how markets behave, not as a script to rerun.
It starts from today
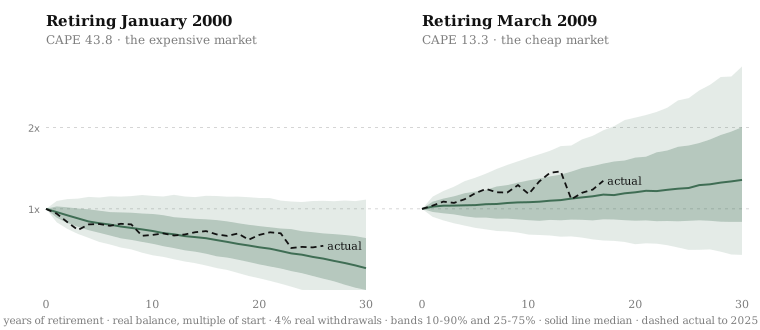
Every simulation opens at the market you actually face: current equity valuations, interest rates, and recent inflation. When prices are high relative to earnings, long-run expected returns are lower and drawdowns cut deeper, and the simulated futures reflect that, even when the answer is sobering.
Below, the same plan and the same 4% withdrawal rule, started into two very different markets. Each fan is the spread of portfolio balances across two thousand retirements simulated by MarketPath: the darker band holds the middle half, the solid line is the median, and the dashed line is what actually happened.
A linked economy, not just a stock chart
A retirement plan lives in a whole economy. MarketPath simulates US and international stocks, nominal bonds, inflation-protected TIPS, cash, inflation, and interest rates as one connected system: inflation shocks push bond yields up and bond prices down, valuations respond to rates, busts are followed by recoveries with realistic timing.
That linkage is what makes the hard scenarios honest. The 1970s pattern, where stocks and bonds fall together while prices rise, emerges from the same machinery as the ordinary years. So does its opposite, the 2008 pattern, where stocks crash, inflation evaporates, and Treasuries rally as the refuge.
The rare decades matter most
Most of the risk in a retirement hides in rare, extended episodes: a deep depression, a decade of stagflation, a bubble that overshoots and pops. MarketPath generates these with the frequency and depth that history and the research literature support, alongside the long ordinary stretches in between, so a plan's score reflects how it holds up when it matters.
How we keep it honest
We backtest the engine across a century of starting points. Given only what was knowable in 1975, or 1990, or 2005, the range it projects has to contain what actually happened, at the advertised rates: the middle 80% of the fan should catch reality about 80% of the time. We also run the classic safe-withdrawal studies through it, from Bengen's 4% work to current forward-looking estimates. When we adopt a study's assumptions, the engine recovers its answer; when we keep our own, every gap has a reason we can point to, like simulating inflation instead of pinning it at a constant average, or starting from today's valuations instead of the historical average.