Care Costs: Why ELCI's Estimates Are Higher Than Others You May Have Seen
Most published figures count what people spend on care. ELCI estimates what the care would cost if you bought all of it. This paper explains the difference and checks our numbers against federal research.
Summary
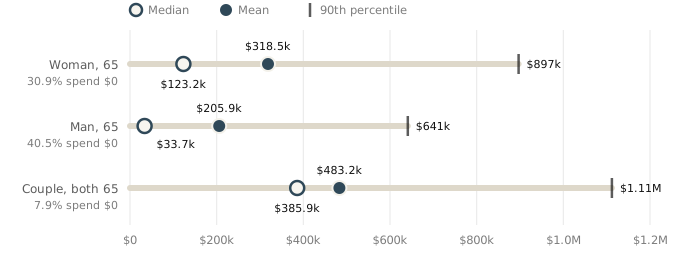
For a woman starting healthy at 65, ELCI's average lifetime care cost is $318,500. For a man it is $205,900, and for a couple who are both 65 it is $483,200. These are averages in today's dollars, including expected growth in care prices, with no long-term care insurance.
An industry benchmark from the actuarial firm Milliman, the 2025 Long Term Care Index, puts the amount a 65-year-old should set aside at $135,000, but that figure counts only paid care. In federal research, families provide most of the years of care older adults receive, without pay; ELCI assumes you buy that care instead.
When family care is counted at the wage of a home care worker, published research lands at or slightly above ELCI's totals: our numbers are high because they include that care. Most people spend far less than the average and some spend far more; one woman in ten spends $900,000 or more.
Two different questions
“What does long-term care cost?” can mean two things: how much money people actually spend on care, or what all the care they need would cost if someone had to pay for it.
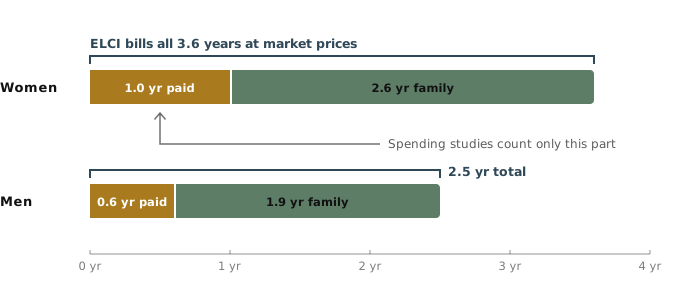
The answers differ because most care is not paid for. In the federal government's projections for people turning 65 now, a woman needs help with daily living for an average of 3.6 years after 65 and receives paid care for about one year of that time; family members, mostly spouses and adult children, provide the rest without pay. For men the figures are 2.5 years of need and about 0.6 years of paid care.
Studies of spending, including Milliman's index and the paid-care tables in the federal research, measure the paid slice. ELCI measures the whole bar. Both are legitimate measurements; they answer different questions.
ELCI is a planning tool, so we chose the second question. A plan should show whether you can afford the care you need without depending on a relative to provide it. If family care is available, your outcome will be better than ELCI shows.
How likely you are to need care
We use the same definition of care need as the federal research and most long-term care insurance policies. A person needs care when they depend on someone else for at least two of six basic activities (bathing, dressing, eating, toileting, moving from a bed or chair, and continence), or when dementia means they need supervision to stay safe.
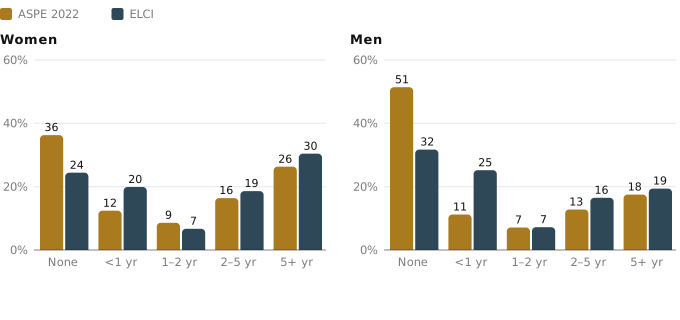
The federal benchmark is a 2022 study by the Urban Institute for the Department of Health and Human Services (ASPE). It projects that 64% of women and 49% of men who reach 65 will need this level of care at some point, and that about 26% of women and 18% of men will need it for five years or more.
On average, ELCI and ASPE agree on how much care people need: 3.5 years for women in ELCI against 3.6 in ASPE, and 2.4 years for men against 2.5. The difference is in how that need is spread across people.
ELCI has more people with short periods of need, under a year, and about 90% of those cases are the final months of life, when a person declines before death. Our timing for that decline comes from a Yale study that tracked older adults month by month in their last year (Gill and colleagues, 2010). These short episodes cost little, as the next section shows.
ELCI also has slightly more people with five or more years of need, mostly because of how we count dementia, which a later section explains.
Where the money goes
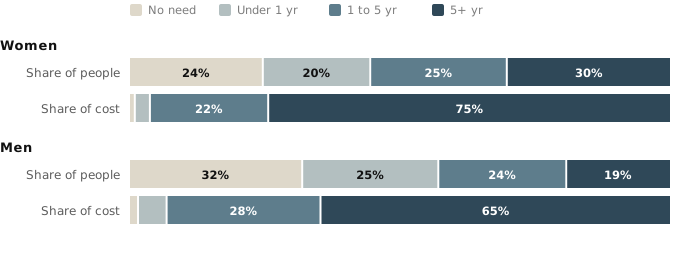
Long-term care costs are concentrated in a minority of long cases. In ELCI, the 30% of women who need care for five years or more account for 75% of women's lifetime care cost; the 19% of men in that group account for 65%.
The short end-of-life episodes that make ELCI's “ever needs care” percentage higher than ASPE's account for about 3% of the dollars for women and 5% for men. The cost estimate depends almost entirely on long cases, and most of those involve dementia.
What ELCI charges per year of care
ELCI prices care at national median commercial rates, in today's dollars. These are the prices a household pays a home care agency or a facility directly, without Medicaid or insurance discounts.
When a person moves to a nursing home, ELCI stops charging that person's household living costs and adds a small allowance for personal needs; the facility fee includes room and board. Care prices rise 1% a year faster than general inflation in ELCI, in line with the long-run gap between medical prices and other prices in national health spending data.
| Situation | How ELCI prices it | Annual cost |
|---|---|---|
| Living at home, dependent in 2+ daily activities | $35/hr, 44 hours a week | $80,080 |
| Living in a nursing home | $315 per day | $114,975 |
| Living at home with dementia and dependent in daily activities | Nursing home rate, paid at home | $114,975 |
| Living at home with dementia, still independent in daily activities, spouse at home | Day programs and respite care | $30,000 |
| Same, living alone | $35/hr, 33 hours a week | $60,000 |
| Limited only in household tasks such as shopping or cooking | Not billed as care; raises everyday living costs instead | $0 care |
Medicare and the first three months
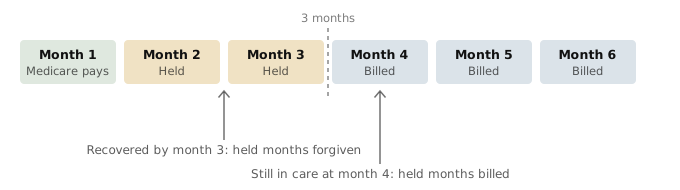
Medicare and supplemental coverage pay for some short-term care after a hospital stay. ELCI uses a simplified version of that rule for every new episode of home or nursing care: the first month is covered, the second and third months are held, and the held months are billed with the fourth month only if care continues. A person who recovers within three months pays nothing.
This rule explains why more people spend nothing on care in ELCI (31% of women, 41% of men) than have no care need at all (26% and 34% of the same simulated lives). Many end-of-life episodes last exactly three months and never reach a bill.
How ELCI counts dementia
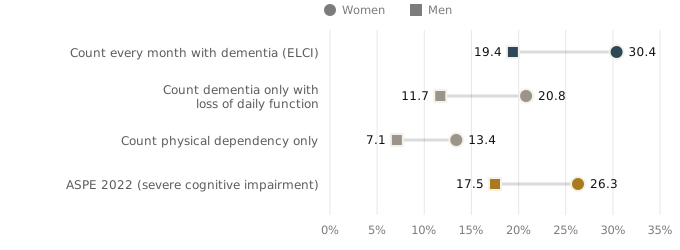
Dementia is the largest driver of long care histories. ELCI counts every month a person lives with dementia as a month of care need, from diagnosis onward, and bills supervision even before the person needs help with physical tasks. In ELCI's long-need group, almost nine in ten people have dementia, and they average about four years with dementia while still independent in physical tasks.
ASPE counts dementia only when cognitive impairment is severe enough to require substantial supervision, which is a later stage. ELCI does not separate dementia into stages, so we tested the effect of counting it in different ways.
Counting every dementia month puts ELCI above ASPE. Counting dementia only once a person also loses everyday function puts ELCI below. ASPE falls between the two, which is what we would expect if its threshold sits partway through the course of the disease. ELCI bills those months at the supervision rates in the price table above.
ELCI's dementia rates are calibrated to the national HRS-HCAP assessment (Manly and colleagues, 2022), and all six age bands fall within that study's confidence intervals.
Averages and typical outcomes
Averages hide how uneven long-term care costs are: many people spend nothing, and a few spend close to a million dollars.
For a man, the average is about six times the median, because 41% of men spend nothing and a small group spends a great deal. For a couple, the chance that neither spouse ever pays for care is under 8%, so the typical couple's cost is much closer to the average.
This spread is why ELCI simulates care as a risk instead of adding a fixed amount to every plan. A fixed allowance near the average overstates costs for most people and leaves the plan untested for the outcomes that do the most financial damage. ELCI shows how often your plan survives those outcomes.
Checking ELCI against published research
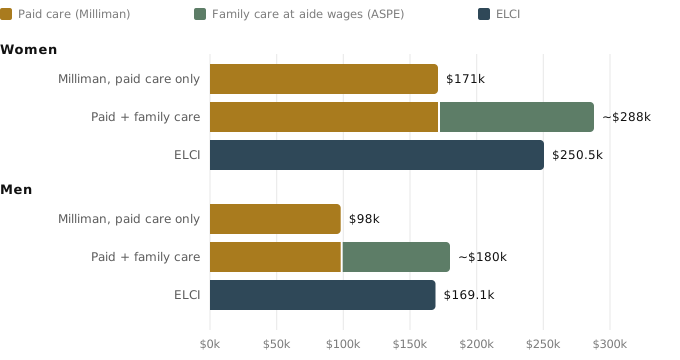
Lifetime cost figures are stated in different ways, and comparing them requires putting them on the same basis. Three conventions matter. “Today's dollars, added up” is the sum of all future costs in today's purchasing power; ELCI's headline figures use this. “Present value at 65” is the lump sum you would need to invest at 65 to cover future costs; it is lower because the money earns a return before it is spent, and Milliman's $135,000 uses it, with a 4.35% investment return and care costs growing 3.5% a year. The third is whether a figure counts paid care only, or paid plus family care.
On both bases, ELCI comes within about 13% of paid care plus family care, and below it in every case. Milliman's paid-care figures and ASPE's paid-care figures agree with each other within about 5% once they are put on the same basis, so the comparison does not depend on which source you trust.
The totals match more closely than the details. ELCI has more short end-of-life cases and more long dementia histories than ASPE, and ELCI prices dementia supervision below home care rates. These differences partly offset, and we report them in the limitations below.
Family care in the federal research is valued at the median wage of a home care worker in the recipient's state (nationally, $13.02 an hour in 2020), for the hours actually provided. The researchers describe this as a lower bound. ELCI prices care at what an agency charges, which is higher per hour.
| Comparison | Women | Men |
|---|---|---|
| Present value at 65, Milliman conventions | ||
| Milliman 2025, paid care only | $171,000 | $98,000 |
| Milliman paid care plus ASPE family care (approximate) | ~$288,000 | ~$180,000 |
| ELCI | $250,500 | $169,100 |
| Today's dollars, added up | ||
| ASPE paid plus family care, updated to 2026 prices (approximate) | ~$342,000 | ~$207,000 |
| ELCI | $318,500 | $205,900 |
Why we price care this way
ELCI estimates whether a household's money can support its retirement, including years when health fails. For care, that means pricing what the household would need to buy if no one in the family could provide it.
Family care has costs that never appear on a bill. Caregivers reduce their working hours or leave jobs, which lowers their own earnings and retirement savings. Spouses who provide care are often elderly themselves, and many people have no relative nearby who is able to help. A plan that works only if a daughter or spouse provides years of unpaid care has a dependency the household should see.
When ELCI shows a plan running short because of care costs, it means the money ran out under these assumptions. If family care will cover part of your needs, or you hold long-term care insurance, your result will be better. ELCI lets you add a long-term care insurance policy to test that.
Known limitations
Family care is largely not modeled. The one exception is in the price table: dementia supervision costs half as much with a spouse at home. Otherwise ELCI does not reduce paid care when a spouse or child is available. This is deliberate and is the largest reason ELCI is above spending-based estimates.
Dementia counts from diagnosis. ELCI does not stage dementia. Counting every dementia month raises the share of people with five or more years of need above ASPE's estimate.
Severity of end-of-life decline. The study we use for the timing of end-of-life decline measured help with at least one daily activity. ELCI treats those months as dependency in two or more. No external data pins this translation. It affects many people but only 3% to 5% of cost.
Spouses' health is independent. ELCI simulates each spouse's health separately, with no shared risk.
National prices. ELCI uses national median prices. Care in some states and cities costs much more, and in others much less.
Simplified Medicare rule. The three-month rule approximates Medicare's skilled nursing benefit and applies it to every new home-care or nursing episode; dementia supervision and assisted living bill from the first month.
Lifetime dementia risk for women. ELCI's lifetime dementia risk for women (about 40%) is below the 48% reported by the ARIC study (Fang and colleagues, 2025). Raising it would push dementia rates at ages 90 and over above the national HRS-HCAP estimates, which we treat as the primary benchmark.
Sources
Johnson, R.W., and Dey, J. Long-Term Services and Supports for Older Americans: Risks and Financing, 2022. HHS Office of the Assistant Secretary for Planning and Evaluation, revised August 2022. Tables 1, 2, 5, 6 and 10, and appendix Tables A3 and A5.
Favreault, M.M., and Johnson, R.W. Projections of Risk of Needing Long-Term Services and Supports at Ages 65 and Older. Urban Institute for HHS/ASPE, January 2021.
Milliman. 2025 Milliman Long Term Care Index.
U.S. Bureau of Labor Statistics. Occupational Employment and Wages, May 2020: Home Health and Personal Care Aides (31-1120).
Gill, T.M., et al. Trajectories of disability in the last year of life. New England Journal of Medicine, 2010. Hardy, S.E., and Gill, T.M. Recovery from disability among community-dwelling older persons. JAMA, 2004.
Manly, J.J., et al. Estimating the prevalence of dementia and mild cognitive impairment in the US: the 2016 Health and Retirement Study Harmonized Cognitive Assessment Protocol Project. JAMA Neurology, 2022. Fang, M., et al. Lifetime risk and projected burden of dementia. Nature Medicine, 2025.
Stallard, E., and Yashin, A.I. Long Term Care Morbidity Improvement Study: Estimates for the Non-Insured U.S. Elderly Population Based on the National Long Term Care Survey 1984-2004. Society of Actuaries, 2016.
Conversions in this paper are ours. ASPE reports dollars in 2020 prices; we update them to current prices with a factor of about 1.3, reflecting growth in wages and prices since 2020. Family care values are re-discounted to Milliman's basis using the timing of ASPE's paid-care costs. Both steps are approximations. Model build m13, October 2026. ELCI is a retirement planning simulation by Precipex; this paper describes how it models long-term care.