LifePath: How ELCI Simulates a Lifetime of Health
ELCI's retirement projections rest on simulated lives, not mortality tables. This paper explains what the LifePath engine models, why the problem is harder than it looks, how the model is checked against published evidence, and where its knowledge ends.
Why health belongs inside a retirement model
Most retirement tools treat health as a footnote: a life expectancy, maybe a one-in-N chance of a long-term care shock priced as a lump sum. But the financial consequences of aging do not arrive as a lump sum. They arrive as a path: a fall at 78 that leads to three months of dependency and then recovery, a slow cognitive decline through the 80s that eventually forces a facility, a final year of intensive care needs after two decades of healthy spending. Two retirees with identical life expectancies can have sharply different cost profiles depending on when impairment starts, how long it lasts, whether it reverses, and whether it ends in institutional care.
The shape of the path also drives the other side of the ledger. Discretionary spending capacity falls when health fails. Travel stops. Housing needs change. A plan that stress-tests only market returns while holding health constant is testing half the problem.
LifePath exists to supply the missing half. For every simulated scenario, it generates a complete month-by-month health history for each member of the household, from current age until death or a planning horizon. The spending engine then prices each of those lives: care costs when care is needed, reduced discretionary spending when function declines, and survival itself determining how long the money must last. The headline ELCI score aggregates over the full distribution of these lives.
The anatomy of a simulated life
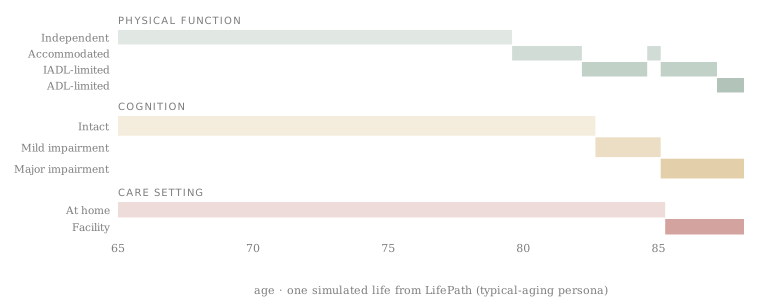
Each simulated person carries three state axes, updated monthly, plus survival. The first axis is physical function, a four-rung ladder running from fully independent, through needing accommodations, through limitation in instrumental activities (managing finances, medications, transportation), down to dependency in basic activities of daily living (bathing, dressing, transferring). That bottom rung is defined strictly as dependency, requiring another person's help, not mere difficulty. The distinction is a large one: difficulty-based survey measures run far higher than dependency-based ones, and conflating them inflates care costs. The model commits to the dependency definition and is calibrated only against sources that measure it.
The second axis is cognition, in three tiers: intact, mild impairment, and major impairment. Mild impairment is modeled as what a standardized assessment would classify in that month, which is a broad and unstable category in the real data, and the model treats it that way. Major impairment, the dementia-like state, is absorbing: the model never grants recovery from it. The third axis is residence: living in the community versus long-stay institutional care. Institutional here means custodial nursing-home residence. Assisted living is deliberately not counted as institutional; the spending engine prices care settings separately, and the care-cost trigger is clinical (ADL dependency or major cognitive impairment), not a building.
Monthly resolution is not a luxury. Most disability episodes in community-dwelling older adults are short. A model that steps annually cannot represent a four-month dependency episode followed by recovery, which is the most common kind, and will systematically misprice both care costs and the odds of bouncing back.
Two speeds of decline
Function declines through two distinct channels, and the model implements both as competing risks each month. The gradual channel moves a person one rung down the ladder, with hazard rising with age, current state, time spent in that state, cognitive status, and the person's underlying risk profile. The acute channel is a direct jump from any rung to full ADL dependency, representing the hip fracture, the disabling stroke, the hospitalization that a person leaves far weaker than they entered. Without an acute channel, a rung-at-a-time model cannot produce the fast onsets that dominate real incident-disability data.
Getting this right is harder than matching a prevalence table. The stock of people who are ADL-dependent at any age is fed almost entirely by progression from the rung above and drained by both recovery and death. A model can match the prevalence snapshot with completely wrong flows underneath: too little onset and too little recovery, or too much of both. The two errors cancel in the snapshot and then diverge badly in the costs, because cost depends on episode duration and count, not on the snapshot. LifePath is therefore calibrated against transition rates and episode-level outcomes, not just prevalence: an unusual discipline, and most of the reason the engine is as intricate as it is.
Recovery, and its limits
The strongest empirical fact about late-life disability is that most of it reverses. In the best monthly-resolution cohort study available (Hardy and Gill's work in community-dwelling adults over 70), about 81 percent of people who became ADL-disabled recovered independence within a year, and even among episodes lasting three months or more, a majority still recovered. A planning model that treats first dependency as a one-way door is not conservative. It is wrong, and wrong in a way that badly distorts both care-cost distributions and the value of planning flexibility.
LifePath's recovery hazard is fit to that episode-level evidence: steep in the first months of an episode, much stickier once an episode becomes chronic, and decaying toward zero in the multi-year tail, so that documented rare three-to-four-year recoveries remain possible while decade-long dependencies do not spontaneously resolve. Recovery moves exactly one rung per month, so a return from full dependency to full independence takes months by construction, as it does in life. Recovery is also conditioned on the things that actually impede it: age, cognitive impairment, and institutional residence.
What the body remembers
A person who recovers from a disability episode is not the person they were before it. The same cohort studies that establish high recovery rates also establish that recovered people relapse at elevated rates, and that only a minority sustain independence long-term after a chronic episode. LifePath encodes this as a hidden vulnerability memory on each axis: recovery restores the visible state but leaves behind an elevated relapse hazard that decays over time toward a permanent floor, with longer prior episodes leaving deeper marks. The memory applies at the point of relapse, deliberately, and nowhere else: mortality and institutional entry are not directly multiplied by history, because the extra time a vulnerable person re-spends in impaired states already reaches those hazards through the state itself. Applying history twice would double-count it.
Cognition gets the same treatment, for a reason the dementia literature insists on: reversion from mild impairment back to intact is common in wave studies, and the model reproduces it. But reverters are not clean slates. They re-enter mild impairment at elevated rates, and a re-entrant case progresses to major impairment at a different rate than a first presentation, reflecting that the reverter pool is enriched for borderline and unstable classifications. These are the kinds of second-order dynamics that are invisible in a transition matrix and that materially change the distribution of lifetime dementia duration, which is one of the largest cost drivers in the whole system.
Mortality, and the final months
Death in LifePath is a hazard layered on top of the health state, not a row in a transition table. The baseline is anchored to the Social Security Administration's cohort life tables, so that the population-level survival curve the model produces is held against the best official projection of how long Americans actually live, by sex, across the full age range. On top of that baseline, the current state modifies the hazard: severe disability and major cognitive impairment carry substantial excess mortality, institutional residence more still, and the combination most of all. The model routes death through severe states by design: milder impairment carries little excess, so people survive long enough to progress, and dependency carries the excess, so death arrives as its downstream consequence. This is what the longitudinal data show, and it is also what makes the care-cost tail honest, because it controls how long the expensive states last.
Two refinements matter here. First, dementia onset and dementia mortality are calibrated jointly: onset controls how many people ever develop major impairment over a lifetime, mortality controls how long they live with it, and point prevalence is roughly their product, so the three targets must be held simultaneously or the model quietly trades one for another. Second, published excess-mortality estimates come mostly from studies of the younger old; applied unchanged to people in their late 90s, they over-predict death. The model attenuates state-driven excess at advanced ages to match observed old-age mortality deceleration.
Finally, the model overlays a terminal decline on most decedents: a short, variable ramp through worsening function in the final months of life, without changing when death occurs. This reflects a robust finding of the end-of-life literature (Gill and colleagues): most deaths are preceded by a period of disability, often brief, and a meaningful minority are not. The overlay is calibrated so that the share of decedents with no disability in their last year, the mix of decline trajectories, and lifetime severe care need all land inside their published bands at once.
Who the simulated person is
People do not age from the same starting point. LifePath carries a small catalog of risk personas, from robust and active through typical aging to profiles carrying metabolic, smoking, frailty, and elevated care risk, plus a general-population mixture of all of them. A persona is a coherent bundle: multipliers on mortality, decline, recovery, institutional entry, and cognitive risk, along with a realistic distribution of starting states. The product offers a simple three-way self-assessment, and a user's choice selects the persona. Persona differences deliberately fade at advanced ages: by the 90s, survivorship and frailty have homogenized the population, and the data do not support carrying midlife risk gradients into extreme old age.
The engine honors what the user declares: the chosen profile and ages are taken at face value, and the model never resamples a user into a risk category they did not claim. For users below 50, the model holds health steady until 50 and begins live health dynamics there, a choice discussed under limits: the model's health transitions are calibrated on data from midlife onward, and simulating uncalibrated dynamics would be invented precision.
Repeatability without steering
The entire engine is deterministic given its inputs. The same household, the same settings, and the same seed produce byte-identical ensembles, every time, on every machine. Each simulated life is an independent, reproducible unit, which means results can be audited, regressions can be caught exactly, and a user's plan does not drift between visits because of simulation noise.
Determinism alone does not remove luck of the draw: a cohort of a thousand simulated lives still carries sampling error in its rare, expensive tails, such as long institutional stays. LifePath addresses this with balanced cohort subsampling: it generates a pool several times larger than needed, measures the pool's own proportions across the outcome strata that drive cost (age at death, lifetime facility months, lifetime dementia), and selects a cohort matching those proportions. One rule governs this procedure: there is no outcome objective anywhere in it. The quota targets are the pool's own large-sample proportions, nothing else, so the selection can only move the cohort toward what the model already says. It removes seed luck. It cannot be used, accidentally or otherwise, to steer the result toward a flattering answer. This is standard survey-statistics practice applied to simulation, and we treat the no-steering property as a design invariant.
How the model is checked
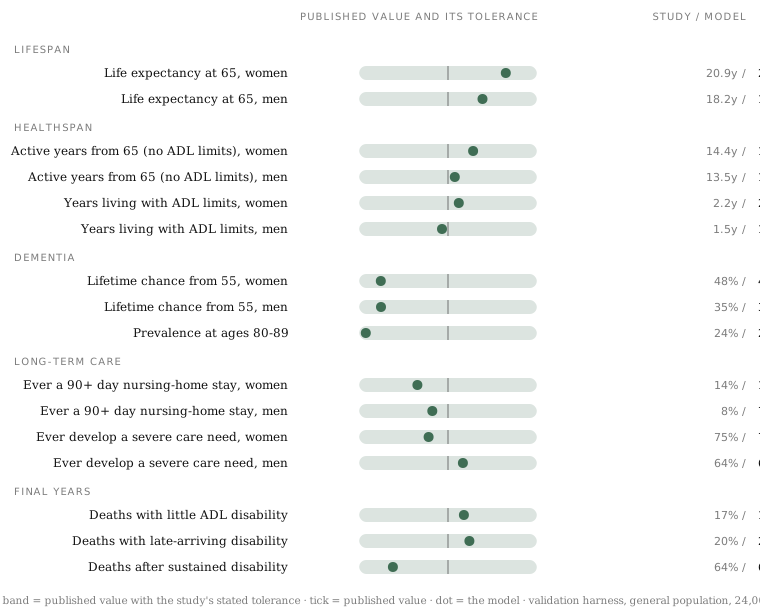
Validation runs against two families of published targets, maintained as versioned data with source citations, and the distinction between the families is the heart of the method. The first family is cumulative outcomes, which gate the model: cohort survival against the SSA life tables across the full age range, life expectancy and active life expectancy, disabled-life expectancy, prevalence of each function and cognition state by age band, lifetime dementia risk, conditional mortality hazard ratios, and lifetime severe long-term care need. Prevalence comparisons are age-standardized where the sources are, community-dwelling denominators are used where the surveys excluded facilities, and small-sample cells are flagged rather than scored.
The second family is the flow audit, and it exists because cumulative targets are churn-blind. A model can pass every lifetime total while transitioning at the wrong rates underneath, and the error surfaces only in costs. So realized monthly and annual transition rates are scored against published bands per transition and age band, recovery is scored by episode duration, and episode-level outcomes are checked against the monthly-resolution cohort literature, with each disability onset attributed to the channel that produced it.
Two points of measurement discipline are easy to get wrong. Cognition sources are wave studies that assess people every year or two, and monthly churn hides between waves; the model is therefore scored against an emulated assessment-wave view for cognition, never by comparing native monthly rates to wave-study rates. And mortality hazard ratios are computed the way the source studies computed them, from status at periodic assessments with mortality follow-up, restricted to community person-time and standardized by age. Done naively, from state at the moment of death, the measurement would capture the terminal decline overlay and report an implausibly steep gradient; done as the sources did it, the model's realized gradients land in the published bands. Matching a number means nothing unless you match the measurement.
Limitations of the model
Some limits are structural. The model has a single ADL-dependency rung, so severity gradations within dependency (one limitation versus five) are unresolvable, and benchmarks that distinguish them are scored at the coarser aggregation the model can honestly support. There is no explicit hospitalization or post-acute state: acute events exist only as their lasting functional consequence, which is also why short skilled-nursing stays are not separately modeled on the spending side. Assisted living is not institutional residence in this model. Recovery proceeds one rung per month by construction. The simulation ends at age 105; the small fraction of lives still alive there are cut short rather than lived out, a slightly optimistic treatment of the most extreme longevity. Below age 50 the model holds health steady and, in the product, does not apply mortality; for a planning tool whose questions begin at retirement this costs little, but it means pre-50 years in a projection are not a health simulation. And each spouse's health path is simulated independently. That is a chosen position, not an oversight: spouses' health does tend to move together, but the correlation is a consequence of shared lifestyle and environment, and imposing an average correlation without modeling its source would add false precision that is wrong for every particular couple. The one separable piece, the temporary rise in mortality after losing a spouse, is on our roadmap.
Some limits are calibration residuals, tracked openly. At ages 90 and above, realized ADL-dependency prevalence runs roughly seven to eight percentage points below the strongest oldest-old dependency study; a candidate fix exists but has not been applied because it risks breaking the episode-level recovery evidence, which we weight more heavily. Long-stay nursing-home entry sits at the light edge of its target band: within tolerance, but light, and we say so. The share of disability episodes minted by the terminal decline overlay versus arising naturally is an open question pending a finer decomposition of the source cohort data. And some targets are in genuine tension: the best dementia flow data, dementia prevalence data, and lifetime dementia risk estimates cannot all be matched simultaneously, and where we chose, the choice and its rationale are documented rather than averaged away.
A note on what these limits mean for a user: most of them bias the model toward slightly understating late-90s care burden and institutional time, which flatters the deepest care tail while leaving the common cases untouched. We prefer to publish the direction of our known errors rather than imply there are none.