MarketPath: The Market Model Inside ELCI
ELCI's retirement simulations run on MarketPath, a structural model of markets, inflation, and crises built to answer a question history alone cannot: what might the next thirty years look like, starting from today's conditions? This paper explains what the model represents, how it is checked, and where it stops.
Why not just replay history?
MarketPath generates monthly paths of US stocks, international stocks, nominal bonds, inflation-protected bonds, cash, and inflation, over horizons of several decades. Every life ELCI simulates draws its market experience from these paths, so the quality of a plan's grade rests directly on the quality of this generator.
The standard alternative is to resample history: chop the last century of US returns into blocks and reshuffle them. We use that technique constantly, as a benchmark. But it has structural blind spots. It contains exactly one historical record, and a famously lucky one: the United States in its best century, measured after we already know it survived and prospered. It cannot produce an outcome worse than the worst year that actually happened. It cannot start from today's conditions, and today's conditions matter enormously: a retirement that begins with stocks priced at historic highs faces different arithmetic than one that begins after a crash. Nor can it distinguish kinds of trouble, such as an inflationary crisis, where bonds fail alongside stocks, from a deflationary one, where they cushion the fall.
So MarketPath is a structural model: it represents the machinery that produces returns (valuations, earnings, inflation regimes, interest rates, crises and recoveries) rather than resampling the returns themselves. A structural model is harder to build and easier to get wrong, so the design rule is strict: the model earns complexity only where resampling inherently cannot help, and everywhere else it must agree with the historical record it grew out of.
The architecture: the economy drives the market, not the reverse
The deepest trap in market modeling is circularity. It is tempting to define a "crash regime" as the periods when stocks crashed, then use that regime to explain why stocks crash. Such a model is an elaborate restatement of its own inputs, and it falls apart the moment you condition it on anything.
MarketPath avoids this by construction. An exogenous macro layer evolves the slow and fast forces of the economy: inflation regimes, a productivity trend, real interest rates, investor sentiment, and rare crises. A separate micro layer consumes that macro state and derives asset returns from it. The causal arrow runs one way: macro conditions drive valuations and earnings, and prices follow. Equity returns are always a prediction of grounded economic channels, never a free input the model can bend to taste.
There is exactly one deliberate reverse arrow, because the real world has one: a deep market crash raises financial stress, stress produces a recession, and the recession drags corporate earnings down, which deepens the crash. This feedback loop is what turned 1929 into 1932. It is calibrated to the observable transmission (how much a severe drawdown historically depressed earnings), it is bounded on both ends so it cannot spiral without limit, and its worst reachable state reproduces the actual depth of the 1929-1932 collapse. Severe recessions also leave a partial permanent scar on earning power, reflecting the research finding that recoveries from deep crises are often incomplete.
Valuation is the spine
The model's central state variable is the stock market's valuation multiple, the cyclically adjusted price-to-earnings ratio. Price is always valuation times earnings, and returns are derived from the motion of both, so the price path can never disagree with the valuation path. A market that starts expensive carries a stored headwind, paid out slowly as the multiple compresses toward fair value; a cheap start carries the matching tailwind. This slow pull toward fair value is one of the best-documented facts in finance, and it is what makes long-horizon returns partly predictable.
Fair value itself is not a constant. It is built from economic fundamentals: real interest rates, the extra return investors demand for holding stocks, inflation (high inflation historically depresses multiples, low inflation inflates them), and the productivity trend. Each channel is disciplined by evidence. Rates, for example, move fair value far less than a textbook discounting formula implies, because history says so: the all-time valuation peak in 2000 occurred with real rates high, not low. That forces the model to carry an independent sentiment state, which can push valuations up or down regardless of rates, matching the awkward historical fact that expensive markets have appeared in every rate environment.
Earnings get the same treatment. A slow-moving productivity trend sets durable earning power, and when it genuinely improves, it both lifts earnings growth and justifies a higher multiple, so re-rating is earned, not free. On top of the trend rides a profit-margin cycle that expands and mean-reverts over several years, and the market prices only part of it, looking through the rest, consistent with the observation that investors do not fully capitalize peak margins. The result reproduces both the long-run growth of real earnings and the historical width of decade-scale earnings outcomes.
Inflation, rates, and why bonds fail when you need them most
Inflation is modeled as a small set of regimes (deflationary panic, normal, inflationary) with realistic persistence. The inflationary regime is rare but long: once an inflation takes hold, it tends to run for years, as it did through the 1970s, rather than flickering on and off. Transitions between regimes ramp in at variable speeds, spanning the historical range from the fast 2021-style onset to the slow grind of the late 1960s. The regime also sets the sign of the stock-bond relationship: in low-inflation decades bonds hedge stocks, in inflationary ones they fall together, which is precisely the decade in which a retiree's "safe" allocation stops being safe.
The bond model reproduces the actual mechanism of the 1970s bond disaster, not just its size. Bond yields in the model track a backward-looking inflation expectation, so when inflation climbs quickly, yields lag behind it. The holder suffers twice: first years of negative real yield while expectations catch up, then a capital loss when yields finally do. Together these produce multi-year real bond losses comparable to the worst stretches of the 1970s. This matters for planning because a model in which bonds merely get a bad random draw, rather than failing for a sustained reason correlated with everything else failing, will quietly overstate the safety of bond-heavy portfolios.
Inflation-protected bonds are modeled as what they are: a real-yield asset with genuine interest-rate exposure. Their yield state rides the economy's real rate, so a rising-rate period produces losses (as in 2022) and a cutting cycle produces gains, and they meaningfully outperform nominal bonds in the inflationary regime. They are a hedge with a price, not a free lunch.
Crises, the rescue, and the one that isn't rescued
Crises arrive as rare discrete events, not just as bad streaks of ordinary volatility, because that is how they arrive in life. A crisis lands a direct crash, paced over months the way real crashes unfold: a violent first leg, then a cascade, with the worst single months bounded by the worst the US has ever actually printed. It also raises the risk premium investors demand, which depresses valuations beyond the initial drop.
Crises come in types, set by the inflation backdrop. In the common deflationary case, the central bank can cut rates and flood the system, and the market stages the V-shaped recovery of 2008 and 2020. In the inflationary case there is no rescue, because the central bank must tighten into the recession, as in 1979-1982, and the loss stands until valuations slowly rebuild. A retiree's spending plan experiences these two crises very differently, and a model that cannot tell them apart cannot price that difference.
The rescue itself is not guaranteed. With low probability, a deflationary crisis goes un-rescued and becomes a depression: an extended, cascading collapse that does not recover within the planning horizon, in the shape of 1929-1932 or Japan after 1989. This is the single mechanism that carries the model's deep left tail, and its frequency is not a dial set by feel: it follows arithmetically from the crisis frequency and the rescue probability, and it lands somewhat below the rate implied by the international record of rare disasters, so the model is, if anything, gentle here. Depressions are rare enough to leave the everyday distribution untouched, but they exist, because they are exactly the sequence-of-returns catastrophe a retirement tool is for.
The upside is modeled with the same seriousness
A model built by cautious people can drift pessimistic by accumulation: every downside mechanism gets built, and the upside is left to ordinary noise. MarketPath guards against this with an explicit design rule: every sustained downside mechanism has a named upside mirror, so the long-run distribution is balanced by addition rather than by trimming.
High-inflation de-rating is mirrored by low-inflation re-rating, the force behind the great 1982-2000 bull market. The crisis crash is mirrored by a rare melt-up, the episodic euphoria of 1999 or 2021, which grinds prices upward over quarters rather than exploding in a month, because that asymmetry of speed (crashes are violent, melt-ups are gradual) is itself a historical fact the model respects. Momentum carries genuine bubbles well above fair value, and elevated valuations are correspondingly fragile: in the model, as in history, a very expensive market is a high-volatility, crash-prone state, not a safe plateau.
The depression's mirror is a secular boom: a rare regime in which a durable productivity improvement arrives, earnings growth and investor confidence rise together, and a high valuation becomes justified and sustained rather than a bubble. The regime resolves honestly in both directions: the growth either materializes, validating the re-rating, or disappoints, and the market discovers it was a bubble after all. This is the model admitting that the optimists might be right, in a way that is testable within each simulated life. Its frequency is a structural judgment, since history offers almost no clean examples to calibrate on, and we say so plainly.
Starting from today
In practice, the model's most important feature is conditioning: it starts each simulation from actual current conditions, including today's stock valuations, bond and TIPS yields, and trailing inflation, rather than from a neutral average. Starting valuation does most of the work in long-horizon stock returns, in both directions. Run unconditioned from a neutral start, the model produces typical outcomes close to the long historical record. Started cheap, as in 1982, its central expectation is correspondingly generous. Started from today's elevated valuations, its central expectation for US stocks is materially lower, in the range of serious independent forward estimates.
A natural objection is that the model's notion of "fair" valuation might simply be set too low, since accounting changes and buybacks complicate comparisons across eras. We tested this directly, and the result is reassuring for an unexpected reason: from a fixed expensive start, the projected return barely moves across a wide range of fair-value assumptions. A lower fair value implies a deeper valuation headwind but also a cheaper, higher-yielding market to revert into, and the two nearly cancel. The sober conditioned outlook is driven by today's observable market price, not by a contestable modeling assumption.
International stocks run on the same machinery with their own valuation loop, and are conditioned on their own current pricing, which captures their present relative cheapness. Their diversification benefit is modeled honestly: correlation with US stocks is moderate in calm times and rises sharply in crashes, because a crisis hits both markets as a common shock. Diversification helps least just when it is leaned on hardest, in the model as in 2008.
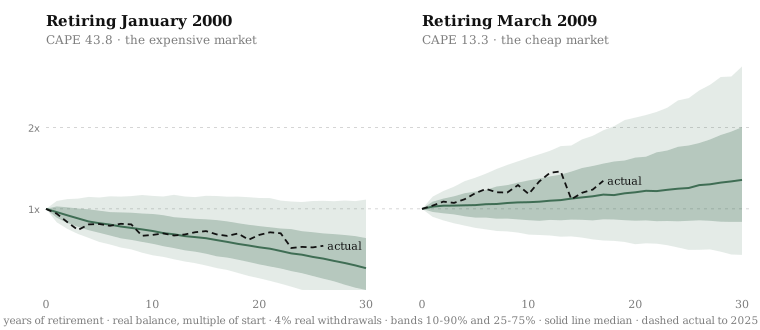
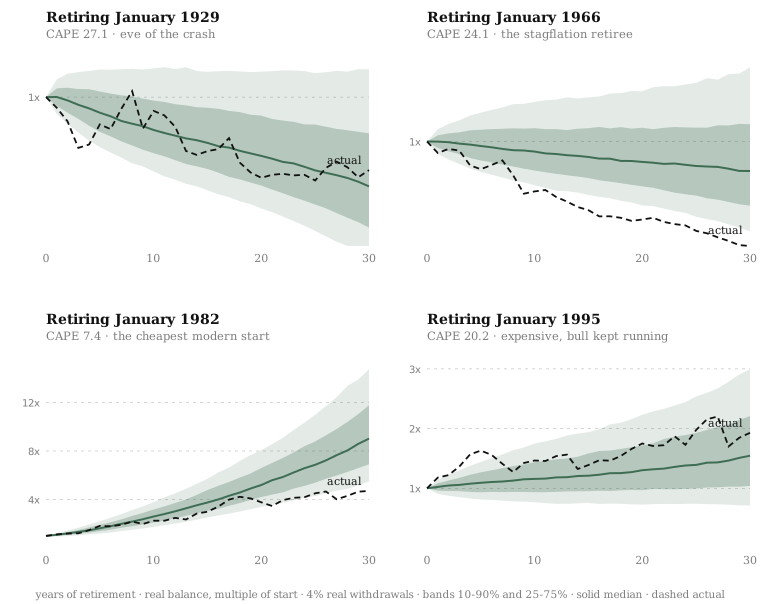
Conditioning is also the easiest part of the model to confront with the record: hand the model a famous date's conditions and nothing else, then overlay what actually happened. Told only January 2000's record-high valuations, it draws a fan whose median glides toward depletion; told March 2009's depressed ones, a growing fan. Followed through 2025, both realized paths stay inside their fans and spend most of the ride in the middle band. Four harder dates put the model under stress. The 1929 retiree falls to the fan's second percentile at the bottom of the Depression and climbs back to finish near the middle. The 1995 retiree rides the upper band through the greatest bull run on record without leaving it. The other two land in the tails, and that is itself part of the test: a model whose fans contained every famous outcome near the middle would be drawn too wide to be useful, or tuned to the answers. 1982's realized run, enormous by any absolute standard, still lands at its fan's fifth percentile, because the fan expected even more from so cheap a start. The one path that escapes its fan entirely is 1966, where inflation persisted beyond what the model credits, a limit already written down in its validation records. Six famous dates: five contained, spread from the floor of the fan to its upper band the way genuine uncertainty should be, and one miss the model's own documentation points to.
How we check it
The governing discipline is that no parameter is ever tuned to make a portfolio outcome look right. Every value traces to history or the published literature, and the handful of genuinely tuned knobs are aimed at pre-declared statistical targets (the shape, spread, and persistence of returns and inflation) in isolation. Portfolio-level results, such as the failure rate of a 4% withdrawal plan, are observed outputs, never fitting targets. Tuning to them would amount to fitting the model to the luckiest market in recorded history.
Validation runs through three complementary tools. First, a battery of distributional checks compares the model, on matched footing, against the historical block bootstrap and published long-run anchors: average returns and volatility for each asset, the negative skew of equity returns, inflation persistence, regime occupancy, the degree to which long-horizon variance is damped by mean reversion, and the historical finding that expensive markets have occurred across all rate environments. Matched footing means that when we compare against studies built on history's actual starting conditions, we start the model from those same conditions; comparing a neutral start against history's often-cheap starts would confuse initialization with dynamics.
Second, a backtest: if the model had been initialized at each historical starting year, at what percentile of its predicted distribution did the realized outcome land? A well-calibrated model scatters those percentiles uniformly; clustering exposes bias. At the ten-year horizon, where there is enough independent data to judge, the model is well calibrated, including at demanding points like the 2000 peak. Third, on withdrawal-rate risk: the model reports meaningfully more thirty-year failure at a 4% withdrawal than the classic US-only Trinity study, and meaningfully less than the broadest global study across many countries. The reason is the same survivorship arithmetic that runs through the whole engine: Trinity inherits America's luck, the single most fortunate national market record, and a model built to sample futures rather than replay that one past carries fatter tails than it does.
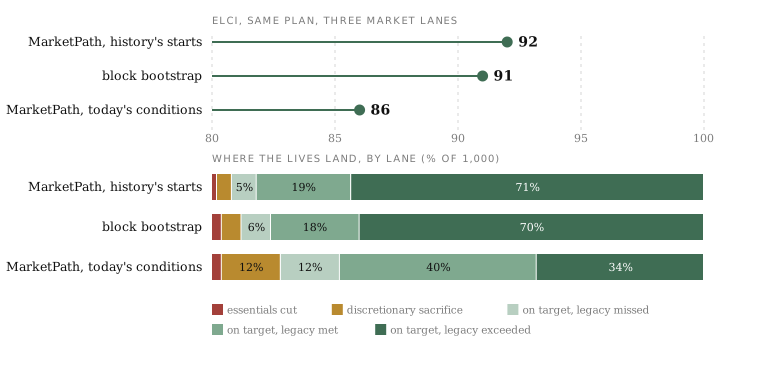
To see what this means for an actual plan, consider a couple in their late fifties with a balanced portfolio, scored three ways. Started from the actual joint conditions of a randomly drawn historical year, the model grades it 92. The block bootstrap, which resamples blocks of the historical record with no model at all, grades it 91, with nearly identical outcomes beneath: fed history's inputs, the model reproduces history's base rate. And conditioned on today's elevated valuations, the same plan lands at 86. Because the model and the record agree when they start from the same place, that haircut belongs to today's conditions rather than to pessimism in the model, and its composition carries the practical message: lives forced to cut essentials move from 1% to 2%, lives finishing above their legacy goal fall from 71% to 34%, and lives trimming discretionary spending rise from 3% to 12%. Starting expensive mostly costs comfort and slack, not survival, and a plan that adapts its spending absorbs the difference as leaner years rather than ruin.
What it does not model, stated plainly
Every scenario the model produces assumes institutional continuity: that markets keep functioning, property rights hold, and valuations eventually revert to something stable. Permanent impairment is out of scope, including confiscation, destructive war on home soil, and financial repression of the 1940s kind, when the government pinned interest rates below inflation for a decade and quietly taxed savers. An un-rescued depression is in the model; the end of the American institutional order is not. Anyone claiming to simulate that is guessing, and we prefer to state the boundary.
Several narrower limits are documented rather than hidden. Inflation-protected bonds in the model do not reproduce their 2008 behavior, when a liquidity panic briefly drove them down alongside everything else, so they are modestly too safe in the one state where a retiree is forced to sell. The modeled bond is treasury-like, with no corporate credit premium, which makes bond-heavy results slightly conservative relative to studies built on corporate bonds. The record's best bond decades are out of reach for a symmetrical reason: the model produces deflationary panics but not a sustained deflationary decade of the 1930s kind, in which long bonds delivered extraordinary real returns. In the sustained-inflation regime, the model currently applies no extra drag to real corporate earnings, so stock results in that specific regime may read somewhat optimistic. And a single uninterrupted bull decade is slightly rarer in the model than in the record, a deliberate trade: making it more common would require fast re-ratings that break the long-horizon variance structure the retirement math depends on.
Finally, some validation evidence is thin by nature. At the thirty-year horizon, a century of data contains only a handful of independent windows, so thirty-year calibration claims from any model, including this one, deserve humility. We treat the long-horizon backtest as a directional check, not a proof, and we document which conclusions rest on strong evidence and which rest on structure and judgment.